Front-end node provides commands to check the usage status of the large-scale computing system.
usage_view
This command shows the information on node-hours consumed on OCTOPUS by the user and the user's group. Also, disk usage by the user and the user's group are displayed.
% usage_view
Execution example:
|
1 2 3 4 5 6 7 8 9 10 11 12 13 14 15 16 17 18 19 20 21 22 23 24 25 26 27 28 29 |
---------------+ Group: G12345 +--------------- [Group summary] OCTOPUS points HDD(GiB) ------- -------------- ---------- usage 0.0 0.0 limit 1000000.0 5120.0 remain 1000000.0 5120.0 rate(%) 0.0 0.0 [Detail] OCTOPUS points Home(GiB) HDD(GiB) ------- -------------- ------------- ---------- user01 0.0 0.0 / 100.0 0.0 user02 0.0 0.0 / 100.0 0.0 user03 0.0 0.0 / 100.0 0.0 [Node-hours] Usage Available* ------------------ -------------- -------------- CPU node 0.22 3924184.75 * Available Node-hour is estimated based on remains of OCTOPUS, Bonus point. |
Detailed explanation
[Group summary]
| OCTOPUS points | OCTOPUS points used by the group, total points allocated to the group, available points for the group, and the usage rate are displayed. |
|---|---|
| HDD(GiB) | For the Work area, the amount of disk size used by the group, the total amount of disk size allocated to the group, the remaining disk size, and the usage rate for the Work area are displayed. |
[Detail]
| OCTOPUS points | The points used to date are displayed for each user. |
|---|---|
| Home(GiB) | The disk usage of the home area is displayed for each user. The values are "used / size / available". |
| HDD(GiB) | The disk usage of Work area is displayed for each user. |
[Node-hours]
| Usage | The Node-hours that the group has used up to now, by node cluster. |
|---|---|
| Available | The value obtained by converting remaining OCTOPUS points into remaining node-hours. (This is the node-hours when the all remaining OCTOPUS points are used on the same node cluster. Please consider these values as reference values only, as this command apply seasonal coefficients.) |
Note
-
- The Node-hours display is updated once daily at 7:00, using data as of 0:00 on the current day. this is not a real-time display.
- Disk information is updated every 15 minutes, but not in real-time.
- Disk usage less than 100 MB is rounded down.
Node Status
-
You can check the status of each node group on the following page:
General-purpose CPU Node Status
How to Read the page
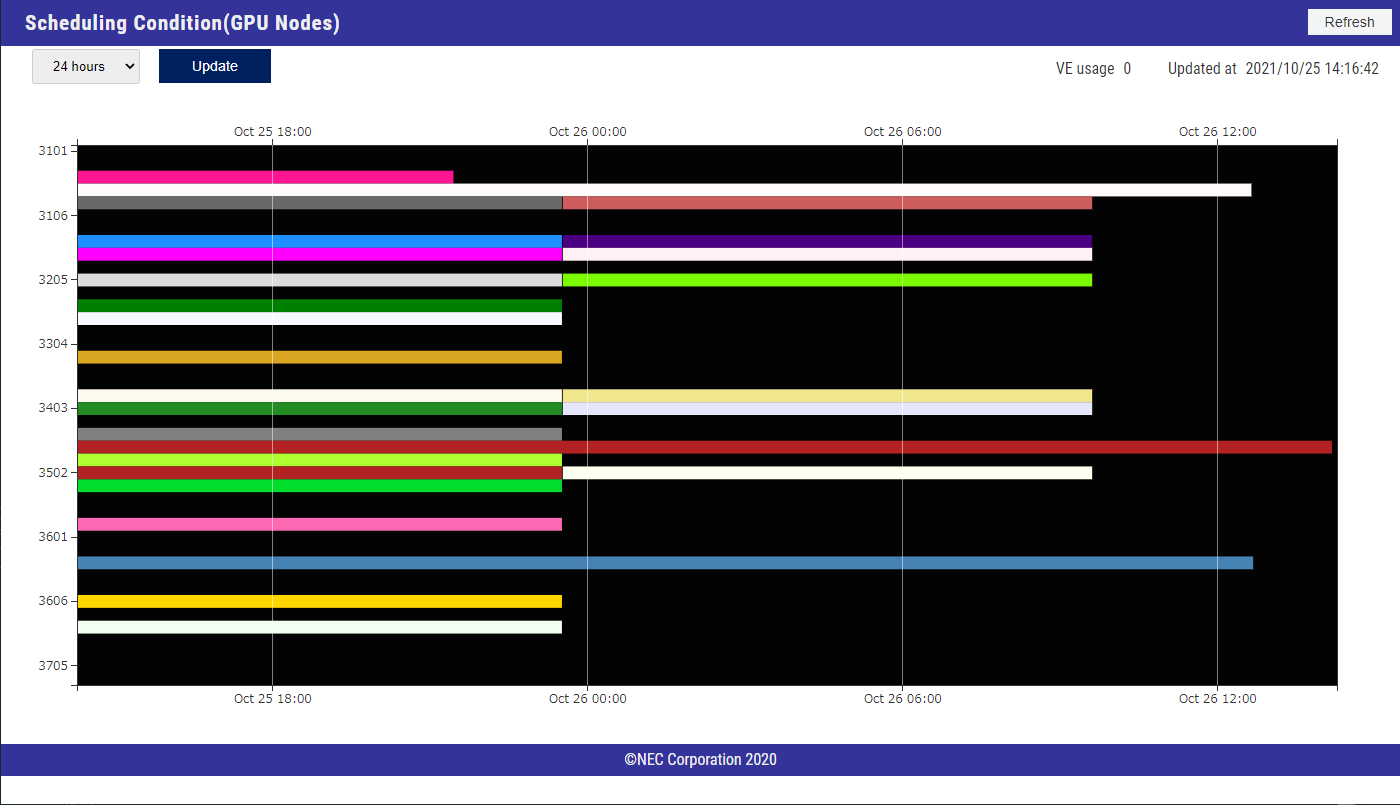
The horizontal axis represents time. The leftmost point is the current time, and moving right shows future times. By default, the status of the past seven days is displayed, but you can change the period using the pull-down menu at the upper left.
The vertical axis represents nodes. The numbers shown are administrative IDs.
Each colored bar represents a job that is running or already assigned, displayed according to the node and time range. Hovering the cursor over a bar shows the request ID.
Usage Information
-
By accessing the following web portal, you can check information such as the number of submitted jobs and node hours used by your group and users.
OCTOPUS Portal
*Two-factor authentication is required to log in to the OCTOPUS portal. For login and usage instructions, please refer to this manual.
