This service ended.
System overview
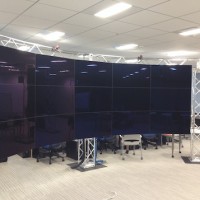
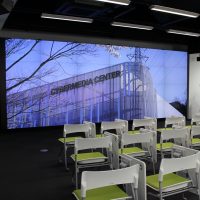
24-screen Flat Stereo Visualization System is composed of 24 50-inch Full HD (1920x1080) stereo projection module (Barco OLS-521), Image-Processing PC cluster driving visualization processing on 24 screens. A notable feature of this visualization system is that it enables approximately 50 million high-definition stereo display with horizontal 150 degree view angle. Also, it is notable that large-scale and interactive visualization processing becomes possible through the dedicated use of PC cluster for large-scale visualization (VCC).
Furthermore, OptiTrackFlex13, a motion capturing system has been introduced in this visualization system. By making use of the software corresponding to the motion capturing system, interactive visualization leveraging Virtual Reality (VR) becomes possible.
Furthermore, high definition video-conference system (Panasonic KX-VC600) is available.
Node performance
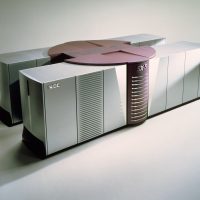
Image Processing PC Cluster on Umemkita (IPC-C) is composed of 7 computing nodes, each of which has two Intel Xeon E5-2640 2.5GHz processors, a 64 GB main memory, 2 TB hard disk (RAID 1), and NVIDIA Quadro K5000. This PC cluster controls visualization processing on 24 screens.
| 1node (IPC-C) | |
|---|---|
| # of processor(core) | 6(12) |
| Main memory | 64 GB |
| Disk | 2TB (RAID 1) |
| GPU: NVidia Quadro K5000 | 1 |
| Performance | GFlops |
System performance
IPC-C is a cluster system which 7 computing nodes are connected on 10GbE. The peak performance of IPC-C is as follows.
| IPC-C | |
|---|---|
| # of processor(core) | 42(84) |
| Main memory | 448GB |
| Disk | 14TB (RAID 1) |
| GPU: NVidia Quadro K5000 | 7個 |
| Performance | Xx GFlops |
Software
IPC-C has Windows 7 Professional and Cent OS 6.4 dual-installed as operating system. Users can select either of operating systems according to their purposes.
The following software are installed on IPC-C.
Visualization software
| AVS Express/MPE VR | General-purpose visualization software. Available for VR display such as CAVE. |
|---|---|
| IDL | Integrated software package including data analysis, visualization, and software development environemnt |
| Gsharp | Graph/contour making tool. |
| SCANDIUM | Image analysis processing of SEM data |
| Umekita | High-quality visualization of stereo structural data from measurement devices such as electron microscope |
VR utility
| CAVELib | APIs for visualization under multi-display and PC cluster |
|---|---|
| EasyVR MH Fusion VR | Software for displaying 3D model in 3D-CAD/CG software on VR display |
| VR4MAX | Software for displaying 3D model on 3ds Max |